Blog
Stay up to date
Subscribe to the blog for the latest updates
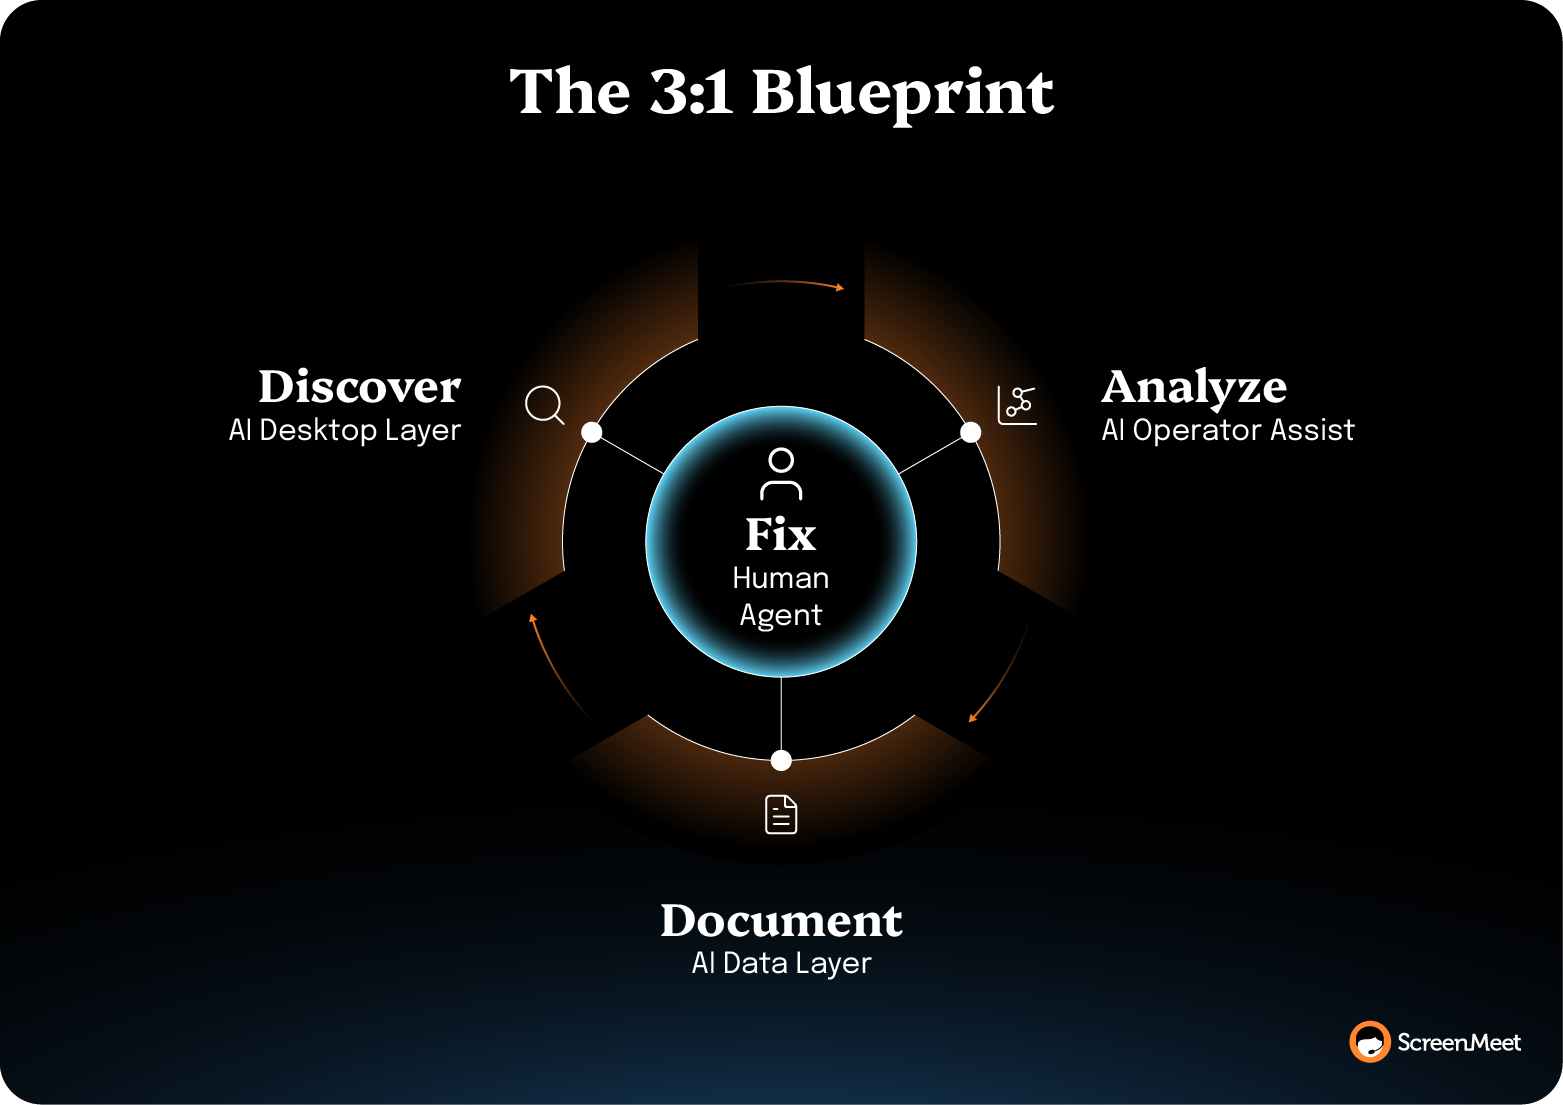
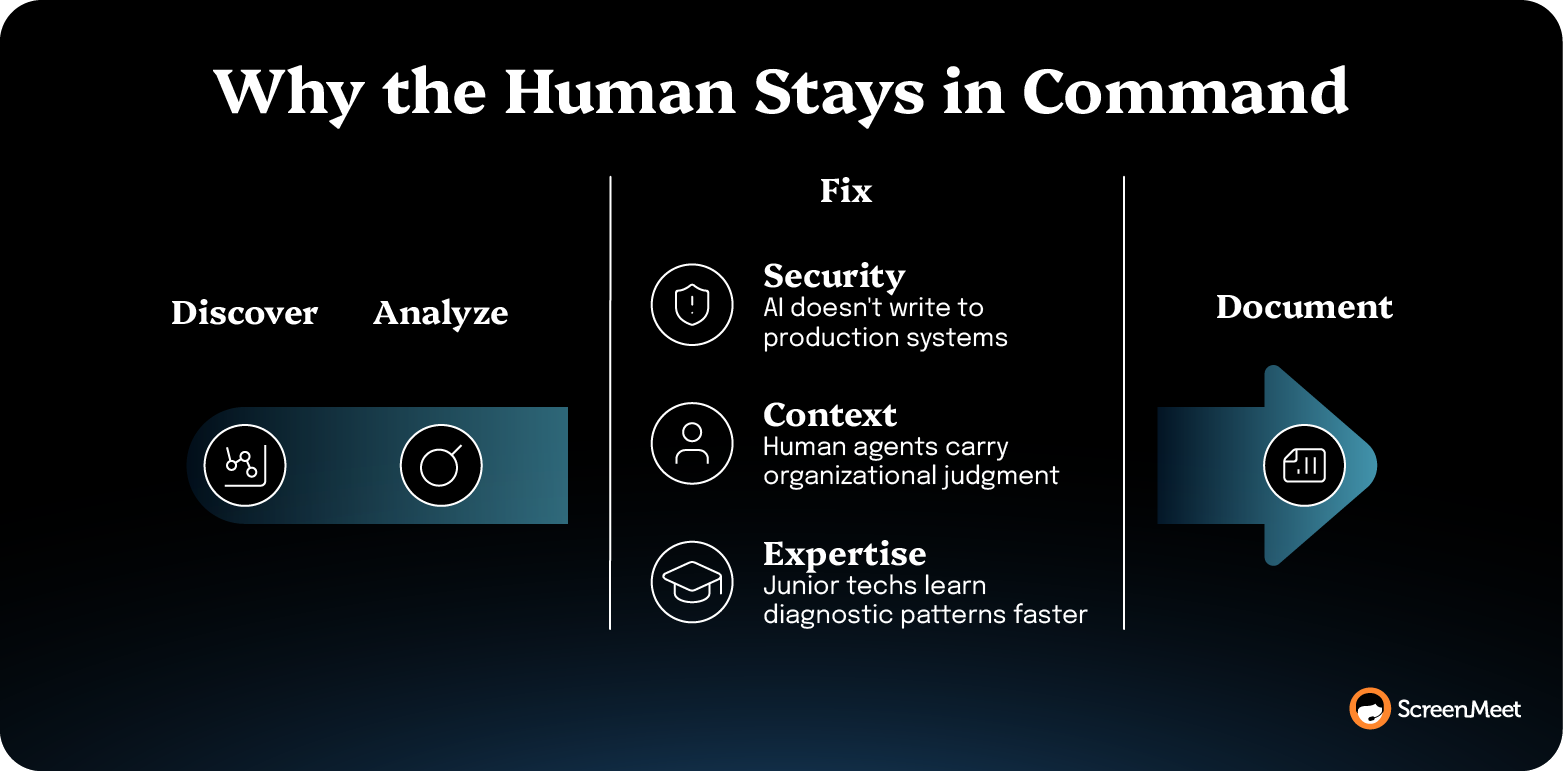
Every remote support session moves through the same four steps.
The technician figures out which device they're looking at and what state it's in.
They diagnose the problem
They execute the fix.
They write up what happened.
Discover, Analyze, Execution, Document — sequential, every session, every incident class.
When it comes to reducing mean time to repair (MTTR), many enterprise teams focus on trying to improve the execution stage and find that the needle barely moves. That’s because, in reality, the execution of fixing a device issue is generally the quickest and easiest step. There’s not much time to trim from the work that actually has to happen.
But the discovery, analysis, and documentation steps are genuinely areas where things can move faster. They’re the three steps that bracket execution and absorb most of an incident's clock.
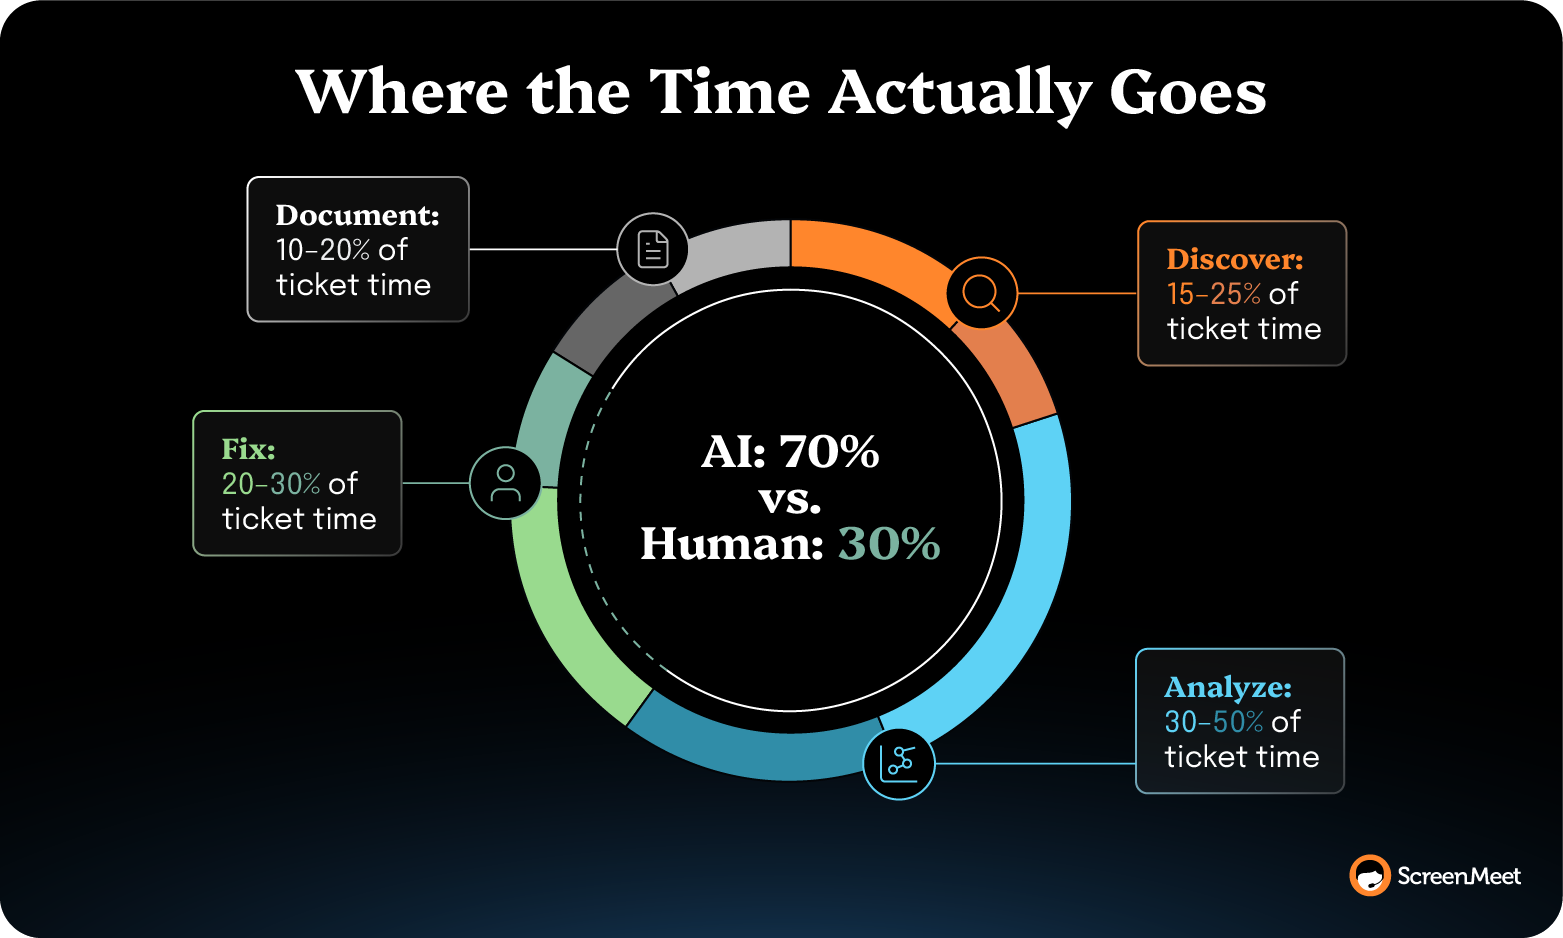
The resolution-clock metric most enterprise leaders carry to executive review spans from incident open to incident close. The average, according to MetricNet's desktop-support benchmark, is around 8.85 business hours.
Addressing MTTR issues means breaking down the aggregate MTTR metric into focused increments and then identifying playbooks that help accelerate each specific stage.
Piece by piece.
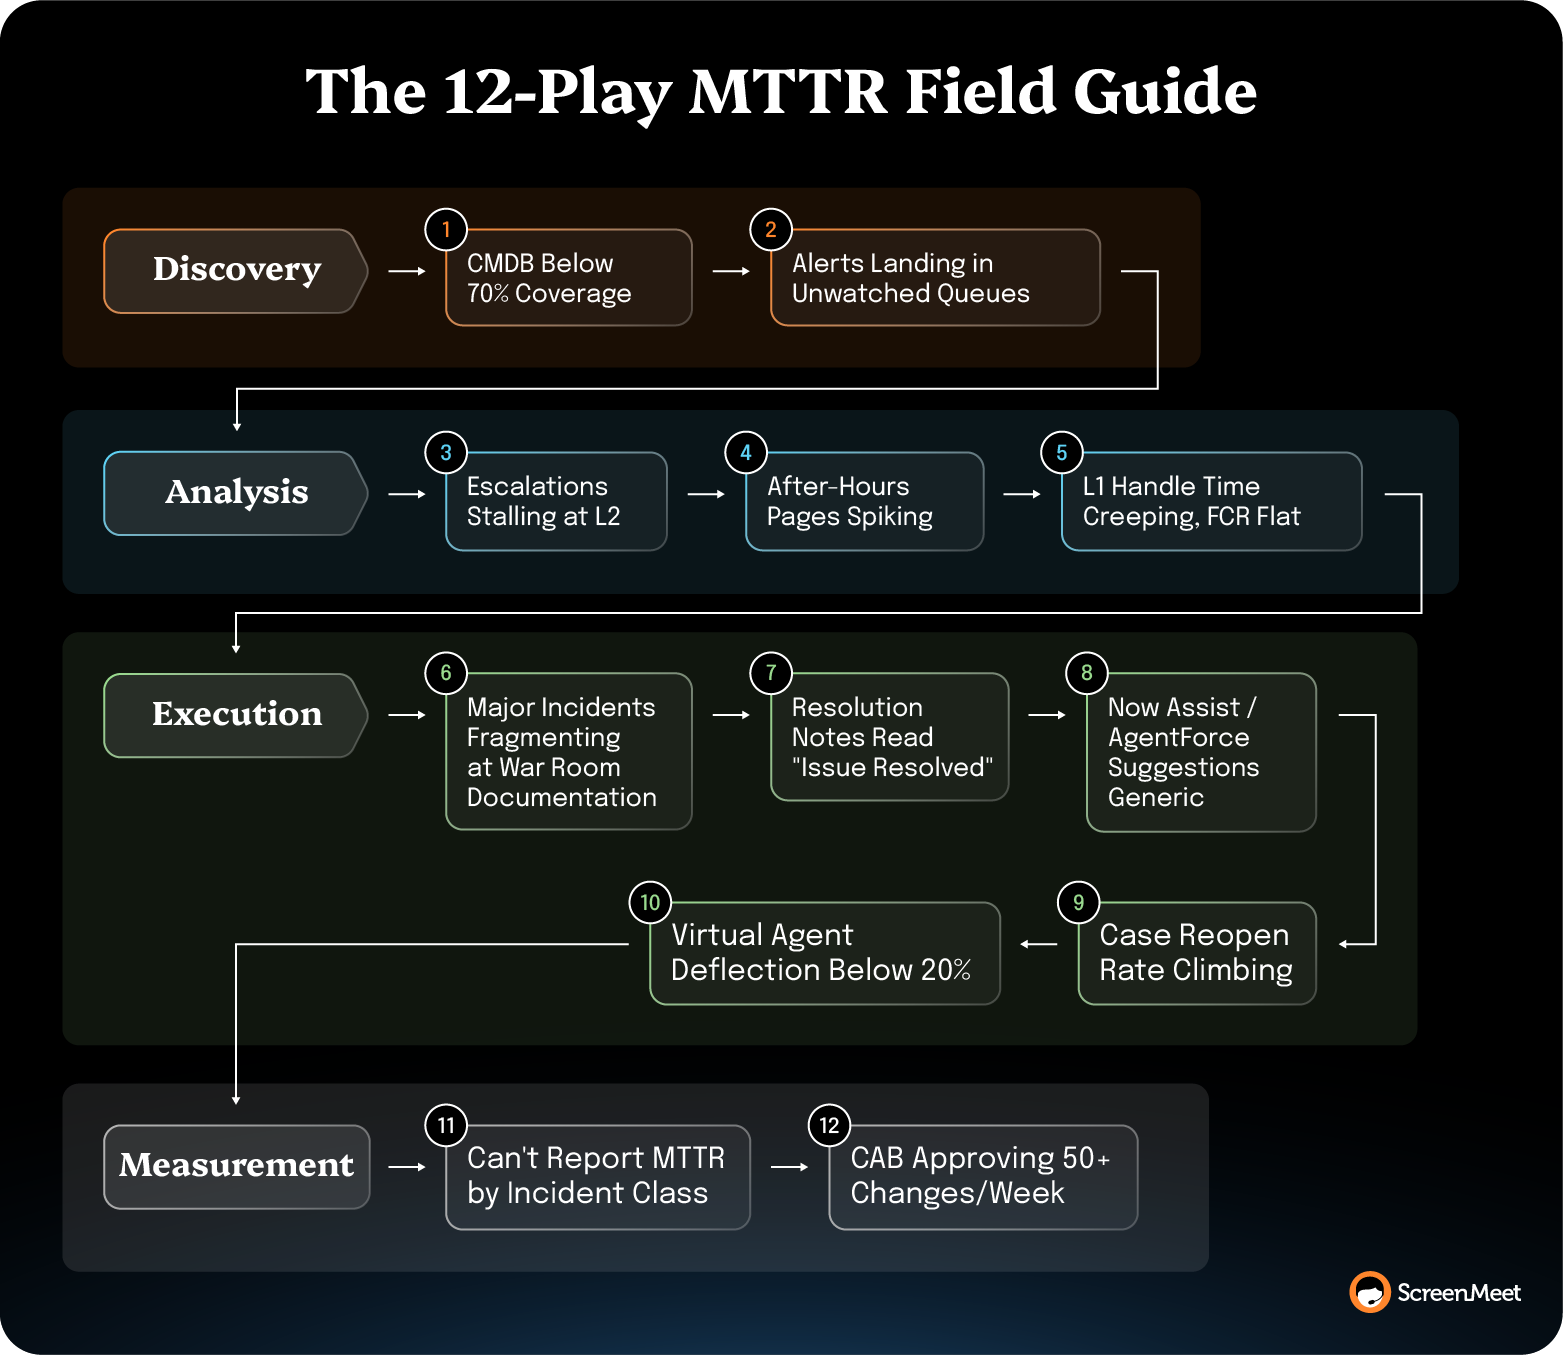
Match each play to the trigger you're actually staring at. Some open with a symptom (escalations stalling at L2, after-hours pages spiking, a specific incident class dragging your average). Others open with a capability state (a CMDB at 70%+ coverage, Now Assist enabled but underused, a CAB approving more than 50 changes a week).
Pick the triggers that apply to your team, run the play.
For most enterprise teams, the single biggest lever in this playbook is deploying specialized AI Agents and Data to attack the three information-processing steps without wading into fully autonomous resolution territory.
The model is augmentation, not replacement.
Current-day AI effortlessly handles device inventory in seconds, surfaces root-cause recommendations in real time, and writes structured resolution notes into the incident as the session closes.
The execution step stays with the human technician. They’re always in the loop.
But with AI taking on three out of the four steps in the resolution process, MTTR improves dramatically.
The deployment shape matters as much as the capability.
AI that runs natively inside your IT service management (ITSM) platform—ServiceNow, Salesforce Service Cloud, or Tanium—has access to the data layer that already exists within your systems. Plus, it can write structured data back to those systems to create more context over time.
Whether or not you start by deploying AI, the plays below address the underlying mechanics that slow down enterprise support teams. About five of the 12 run AI-agnostic. They’re pure platform and process discipline. The other seven assume AI is in place to produce their compounding effect. Without it, those plays still run, but the gain is capped, ages faster, and doesn't feed downstream platforms like Now Assist, Agentforce, or Virtual Agents.
Initial device discovery speeds up when AI Agents and human technicians trust what they find in the CI record.
Configuration management database (CMDB) hygiene is the foundation. When the configuration item (CI) record is missing, stale, or wrong, the first 10 minutes of every session go to the technician asking the user what they're running.
That's MTTR you don't get back.
CMDB coverage is the upstream lever. If your CI population is patchy, the session has to reconstruct the context that the platform should already have. The longer the CI population stays incomplete, the longer every incident's Discover step takes.
Treat CMDB coverage as an MTTR input metric rather than a platform-hygiene project.
Set a coverage threshold tied to the incident classes that drag your average, then close the gap before chasing in-session efficiency gains.
The order matters here because the biggest unlocks (like deploying AI agents to accelerate discovery) rely on these data foundations.
Even ScreenMeet’s AI Discover Agent needs a CI record that’s reliable enough to ground it.
Time spent in the Discover step usually falls when CI coverage on the most-incident-class segments crosses 70–80%.
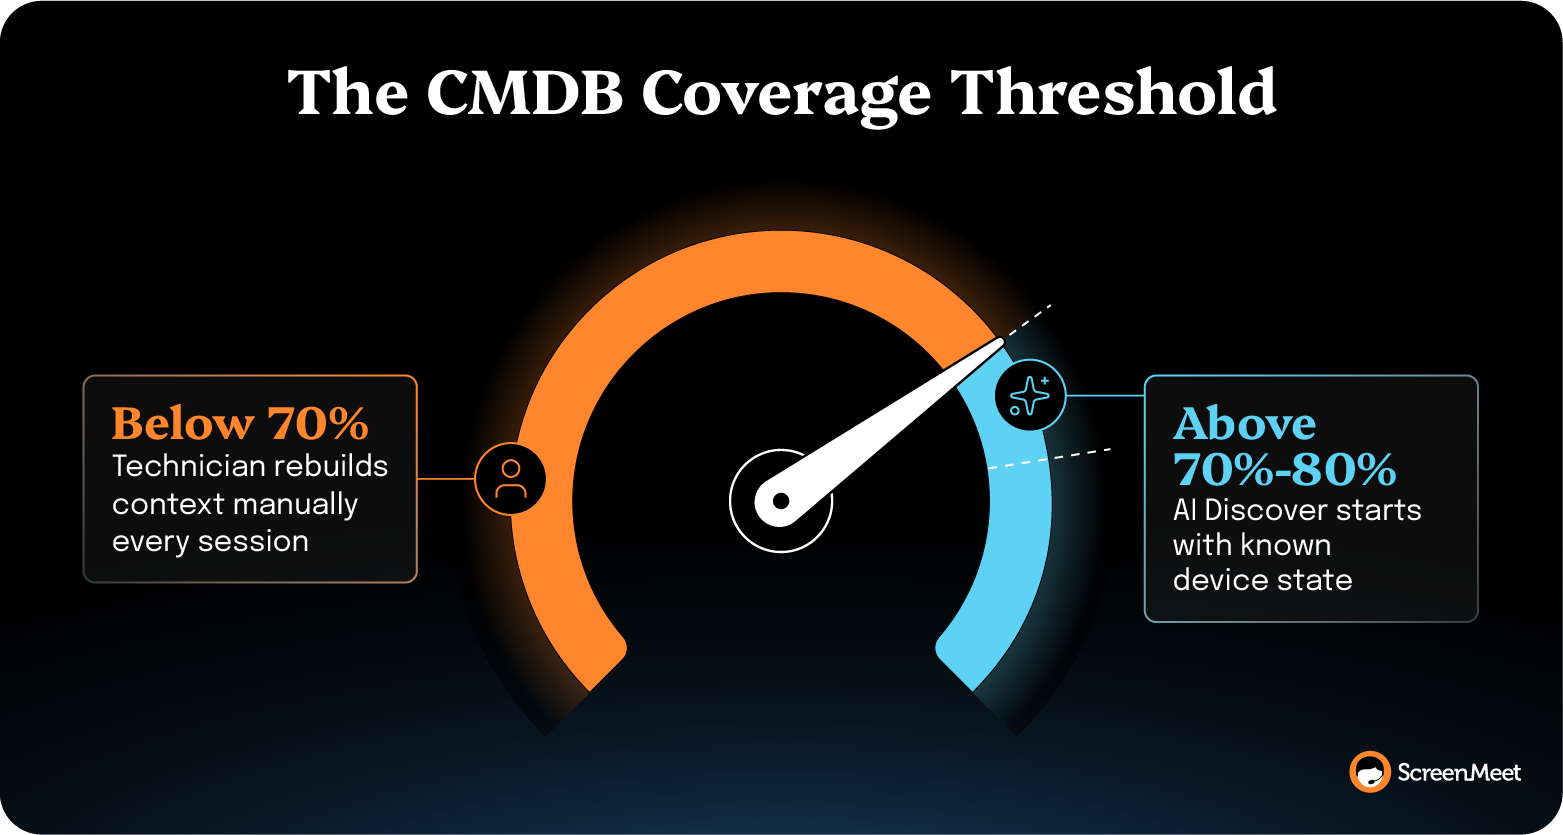
Pair the coverage gain with a session tool that reads from the platform's CI record at session launch, and Discover compresses from an open-ended diagnostic to a populated context that the technician confirms.
ScreenMeet for ServiceNow launches sessions natively against the incident's CI record, which means the AI Discover step starts with the platform's known state rather than reconstructing it.
Failure modes: CMDB coverage projects stall when ownership is unclear, or the metric isn't tied to an operational outcome. If platform engineering owns coverage but support owns MTTR, the gap closes slowly. Tie coverage to MTTR in the same scorecard, or the project drifts.
L1 visibility is an upstream Discover constraint that most teams underestimate.
If an alert routes to a generic queue, sits for 14 minutes, and gets assigned to a tech who needs another six minutes to figure out which user is affected, you've burned 20 minutes before Discover even starts.
That time shows up as MTTR even though it's purely a routing problem.
The pattern shows up most acutely in distributed support teams where queue ownership is mapped to function (network, identity, endpoint), but incidents arrive cross-functionally.
A VPN ticket with an authentication root cause sits in network for an hour before someone routes it to identity.
Tighten the path from alert to assigned owner.
Severity-level routing, channel-based incident creation, and skill-based assignment all move the same lever. They work together to shorten the gap between the event and the right tech holding the ticket.
Apply them in the order that matches your routing breakdown.
Tightened routing typically cuts the pre-Discover window by half on the affected incident classes. It shows up as MTTR dropping without any change to the work the technician actually does. That's the cheapest MTTR reduction you'll find.
Failure modes: Routing rules drift. A rule that worked in 2024 against a 2024 incident mix doesn't hold against a 2026 mix. Make routing-rule review part of the quarterly KPI cadence, or the gain decays.
The analysis step shrinks when the technician inherits a session rather than an incident.
Assuming structured AI summaries are running on the L1 side, the basics should be inherited (what the device showed, what was ruled out, what was tried—all carried forward).
Without AI on L1, the play still works, but it relies on human-written summaries, and inconsistency caps the gain.
That re-discovery time has major MTTR costs for most L2 escalations.
When Tier 2 picks up an escalation 40 minutes before the service level agreement (SLA) and the notes field reads "escalated per SLA," everything Tier 1 already discovered, ruled out, or tried is gone.
The work resets. But the clock doesn’t.
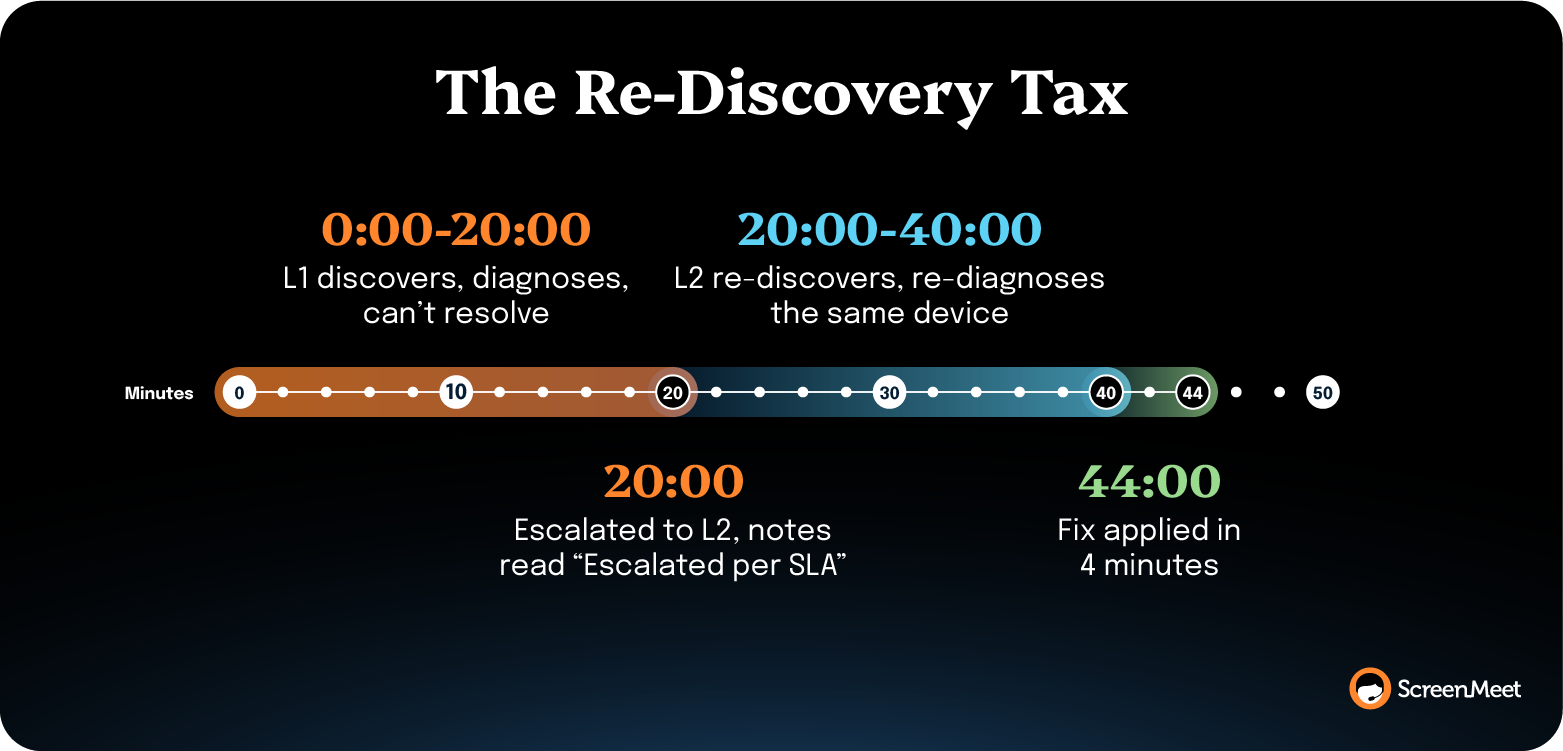
Tier 2 calls the employee back, re-runs the device check, and starts the diagnostic from scratch. The incident management workflow audit walks through how this plays out at the ticket level.
Make session continuity the carrier of escalation context.
Every L1 session needs to write structured diagnostic data into the incident record so L2 inherits it: what the device showed, what was ruled out, what was tried. The goal is capturing the diagnostic during the call as a byproduct of the session, rather than writing more notes after it.
When the L2 tech reads the L1 session summary before the callback, most teams see the L2 Analyze window drop by 30–50% on classes where structured summaries replace freeform notes.
Customer experience company TTEC reported a 38% reduction in average handle time and dropped calls from 45 minutes to 28 minutes after running structured AI summaries across their 300-person support team.
The 38% comes from the same compression you're chasing. Diagnostic context flows forward instead of being rebuilt at each handoff.
"Now we can spot the 4 steps that fix a recurring issue and eliminate the other 23 unnecessary ones," said Derek Chase, Executive Director at TTEC. "It's not only efficiency. It's knowledge."
Failure modes: Summary quality can degrade when the AI is generated from a remote tool that sits outside the system of record. If the L1 session ran in a separate app and the summary writes back via integration, you lose half the context that the integration wasn't designed to carry. The summary needs to be generated against the same record that the L2 tech is reading from.
After-hours pages are a timing problem rather than a routing problem.
Assuming AI can pre-stage Discover context automatically when the alert fires, the page-to-context window closes fast. Without that, the same play runs as a scripted runbook.
When SEV 1 and SEV 2 incidents arrive at 2 a.m., the on-call's MTTR is dominated by context recovery: who's the user, what's the device, what's the platform state.
As with almost every incident, the execution is fast once the diagnosis is right.
The expensive part is the on-call tech building the picture from a cold start.
This pattern shows up sharpest on platforms that span time zones. A 2 a.m. Asia-Pacific page hits a European on-call who's never touched the affected user.
The on-call spends 25 minutes reconstructing the context that a US business-hours technician would have built in two minutes from working memory.
Build your on-call team’s Discover and Analyze context proactively before they need it.
Make the page-to-context window as short as possible by pre-staging device state, recent ticket history, and any pre-existing diagnostic against the affected user the moment the alert fires.
Now Assist or Agentforce can also run a Recent Incidents lookup against the same device class and surface the three most likely root causes from the historical data feeding the platform.
By the time the on-call tech opens the incident, the diagnostic foundation is already there.
After-hours MTTR is the slice most resistant to handle-time gains.
Pre-staged discovery context compresses the SEV 1 window by 30–40% across most enterprise deployments, mainly by eliminating the dead clock between "page received" and "diagnostic started."
The execution itself doesn't change.
Failure modes: Pre-staged context only helps if the on-call trusts it. If the automated Discover produces stale or wrong data, your on-call team ignores it and runs the manual diagnostic anyway. The quality of the CI record is the upstream constraint. If your CMDB coverage is weak, this play won't compound.
When L1 average handle time creeps up, but first call resolution doesn't move, the gain comes from compressing routine incidents, not from cracking harder ones.
The Analyze step on a routine incident doesn't need a senior tech. It needs the diagnostic foundation every senior tech carries in working memory, delivered to the L1 in real time.
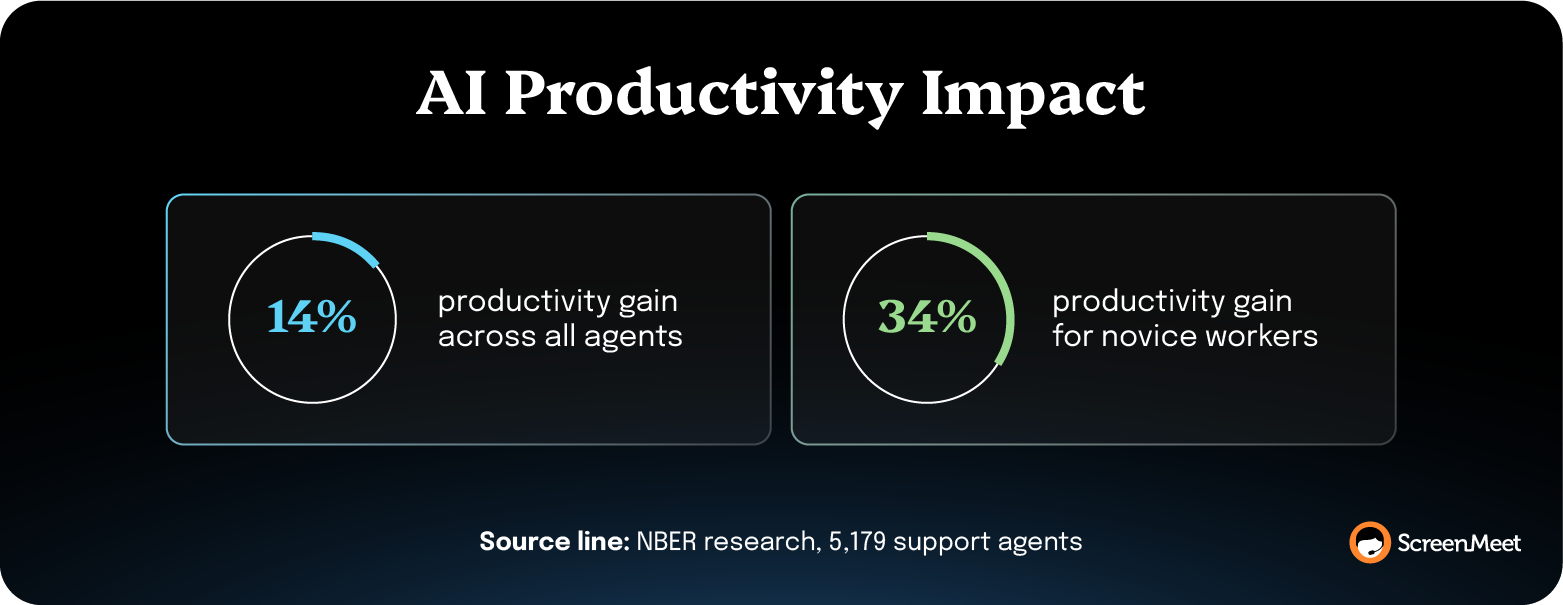
National Bureau of Economic (NBER) research on 5,179 support agents using a generative AI assistant found 14% productivity gains on average, with 34% gains for novice workers. The mechanism that the authors named: the AI disseminates the best practices of senior workers to the rest of the team.
That's the L1-compression pattern.
Give every L1 the analyzing horsepower of a senior engineer behind them during the session.
This is, in effect, the AI deployment for L1.
If AI Assist isn't running in your stack yet, deploying it is the first move. AI Assist reads from the customer's own KBs and surfaces the right resolution path in real time while the technician runs the session. The execution stays with the human. The underlying diagnostics become shared infrastructure.
Salesforce's customer support team reported a 35% increase in first-call resolution after running ScreenMeet on Service Cloud, per a Salesforce case study.
"We saw a 35% increase in first call resolution," said Jim Roth, EVP Customer Support, Salesforce. "That's because a picture's worth a thousand words. And when you can see what your customers are seeing, you don't need to describe it."
The compression lives in the Analyze step, running against confirmed visual context. The execution itself doesn't change.
Failure modes: AI Assist suggestions degrade fast when the underlying KB is thin or stale. If your KB corpus is a graveyard of pre-2023 articles, the in-session recommendations will be too generic to be useful. Run the Documentation plays in parallel—the KB has to keep getting better, or the Analyze gains plateau.
Major incidents (SEV 1, SEV 2) are the bucket where process discipline moves MTTR.
When eight engineers are pulled into a war room, and there's no single decision-maker, the first 45 minutes are spent figuring out who's running it.
Per Atlassian's incident-commander guidance, the IC is "the primary point of contact and source of truth about your incident… they see the big picture, manage all the moving pieces, know what's been tried and what's still on the radar."
The execution at SEV 1 accelerates through clearer authority.
Pre-assign incident commander rotation and publish the auth chain.
Every SEV 1 and SEV 2 has a named IC before the page fires—by shift, by region, by domain. The IC's job during the incident is to coordinate, decide, and delegate. They don't troubleshoot, check graphs, or run commands.
A clear IC reliably cuts SEV 1 MTTR by removing the early-phase decision-paralysis window.
The gain concentrates in the first 30 minutes of the incident, the part where the war room is figuring itself out. Once the team is moving, the IC's job is mostly holding the line on scope.
Failure modes: IC rotation breaks when the named IC isn't trained or trusted. If the senior engineer in the room overrides the IC's decisions, the role collapses, and the team reverts to no commander. Authority has to be granted explicitly and re-granted in post-mortems when it gets challenged.
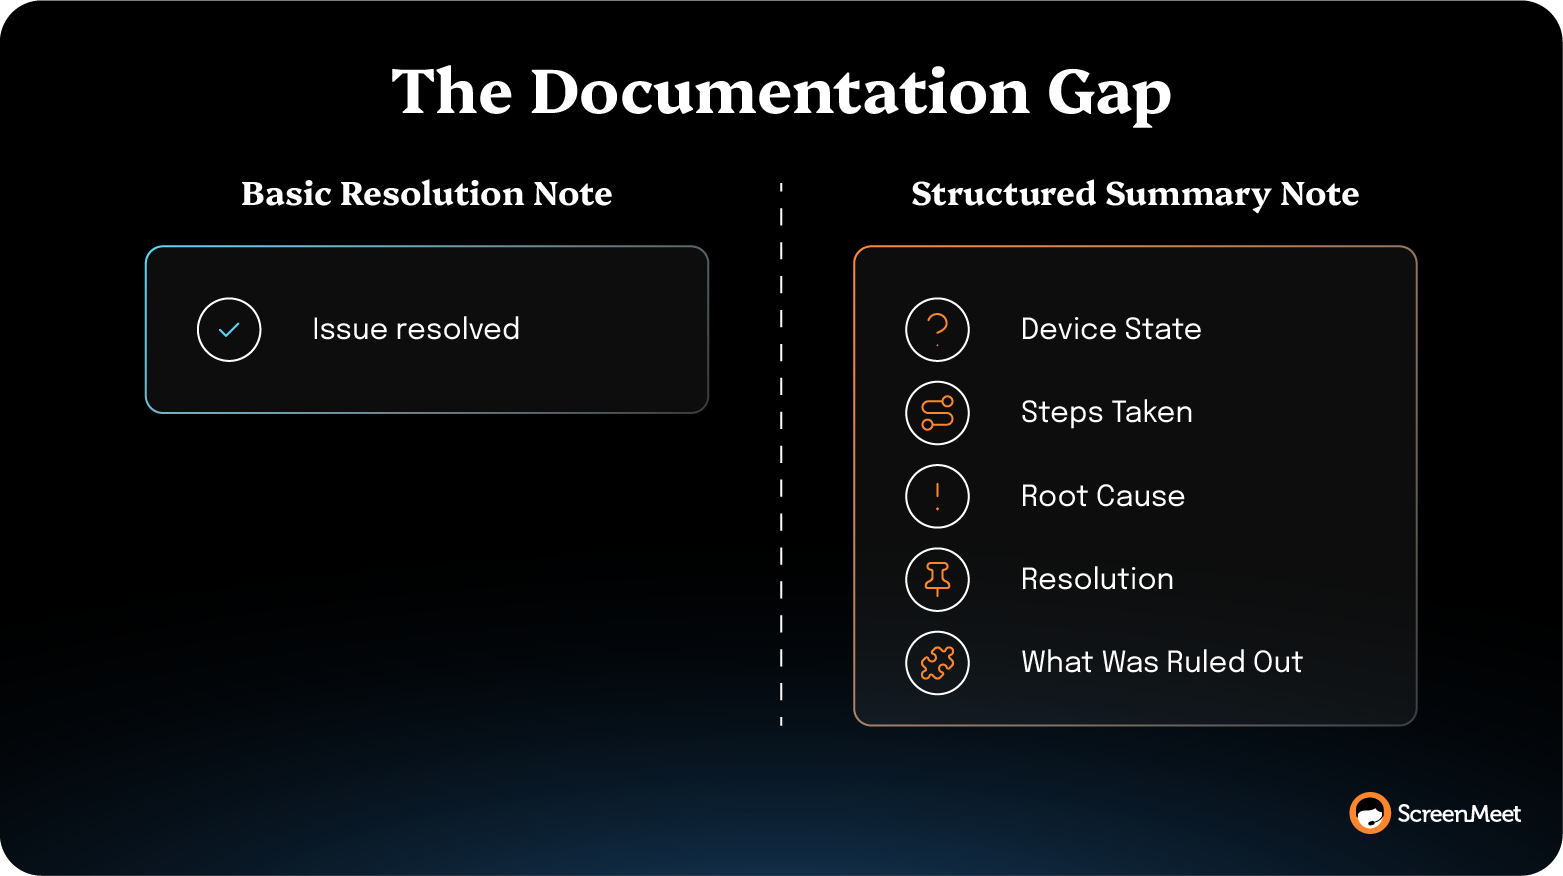
Open any resolved incident in your ServiceNow instance and scroll to the resolution notes.
If most say "Issue resolved," "Fixed per user request," or "Done," the Documentation step is one of your most immediate and important plays for improving MTTR.
Empty resolution notes are the visible symptom of structured session data being lost between the remote support tool and the system of record.
The highest-leverage Documentation move in the entire playbook is deploying a specialized agent to write AI summaries directly to each incident. Without AI, you can mandate structured manual notes—same shape, real but limited gain, because adoption falls off when techs are writing them by hand.
There’s also the architecture gap. When the remote support tool sits outside the system of record, the technician has to manually transcribe what happened into the ticket after the session.
They don't. Nobody does.
The AI Data Layer created by structured, consistent, human-readable incident summaries feeds every downstream play and unlocks massive efficiency across the board.
Make the Document step automatic, structured, and native to the incident record.
Every session writes a step-by-step resolution summary directly into the ticket as the session closes—what was discovered, what was tried, and what worked, in the platform's own data structure. The technician doesn't write notes after the call.
With a platform-native solution like ScreenMeet, that’s all it takes. There are no new tools to deploy or rip-and-replace fire drills to work through.
ServiceNow's internal IT team deployed this against 18,000 global employees and reports that ScreenMeet handles 80% of all Service Desk cases, with structured resolution data written back to every incident.
"It was the smoothest move we’ve ever done with a tool," said Liran Daniel, Employee Experience Innovation Manager at ServiceNow. "Because session notes, screen shots, call recordings, and other information are automatically added to the incident, the biggest benefit so far has been the time savings, requiring fewer steps to get everything into the ticket."
The 32% L1 FCR increase and $1M+ annual cost reduction that the case study reports both trace to the same compression. The Document step runs as a byproduct of the session instead of as a separate workstream the tech has to fight to finish.
Resolution-note quality goes from "Issue resolved" to a structured record of the diagnostic and execution path on every ticket. The downstream effects compound—KB articles get easier to write, reopen rates drop, search relevance improves, and the AI Data Layer starts feeding Now Assist with real resolution context.
Failure modes: Structured summaries lose value if the technician can't trust them. The play fails if the summaries get rolled out before they're audited.
Now Assist, Agentforce, and Virtual Agents all run on the same input: Structured resolution data inside the platform of record.
This play assumes two pieces of AI are running—the upstream AI Summary capturing structured session data, and the downstream model (Now Assist on ServiceNow, Agentforce on Salesforce Service Cloud) consuming it.
When organizations stand up the AI capabilities in either platform and find adoption lagging, the typical diagnosis is "we need better prompts" or "the agents need training."
The real diagnosis is usually upstream.
Without AI feeding the documentation layer, suggestions stay generic regardless of how much you tune the model.
The ITSM team turns on KB article suggestions, the suggestions return mostly generic results, the L1 techs or case agents stop opening the panel within two weeks, and adoption never recovers. The suggestions are weak because the underlying KB and resolution corpus have nothing structured to learn from.
Service Cloud's specific shape is worth naming. Cases run longer than ITSM incidents on average, with more multi-touch interactions across channels. The Documentation step on a Service Cloud case has to capture both the execution and the full case trajectory across every channel, every handoff, every escalation.
Treat structured documentation as the upstream investment in your downstream AI.
Start by feeding the suggestion model. Every session needs to write structured Discover, Analyze, and Document data into the incident or case record so Now Assist or Agentforce has something material to learn from.
This is how you unlock the knowledge loop.
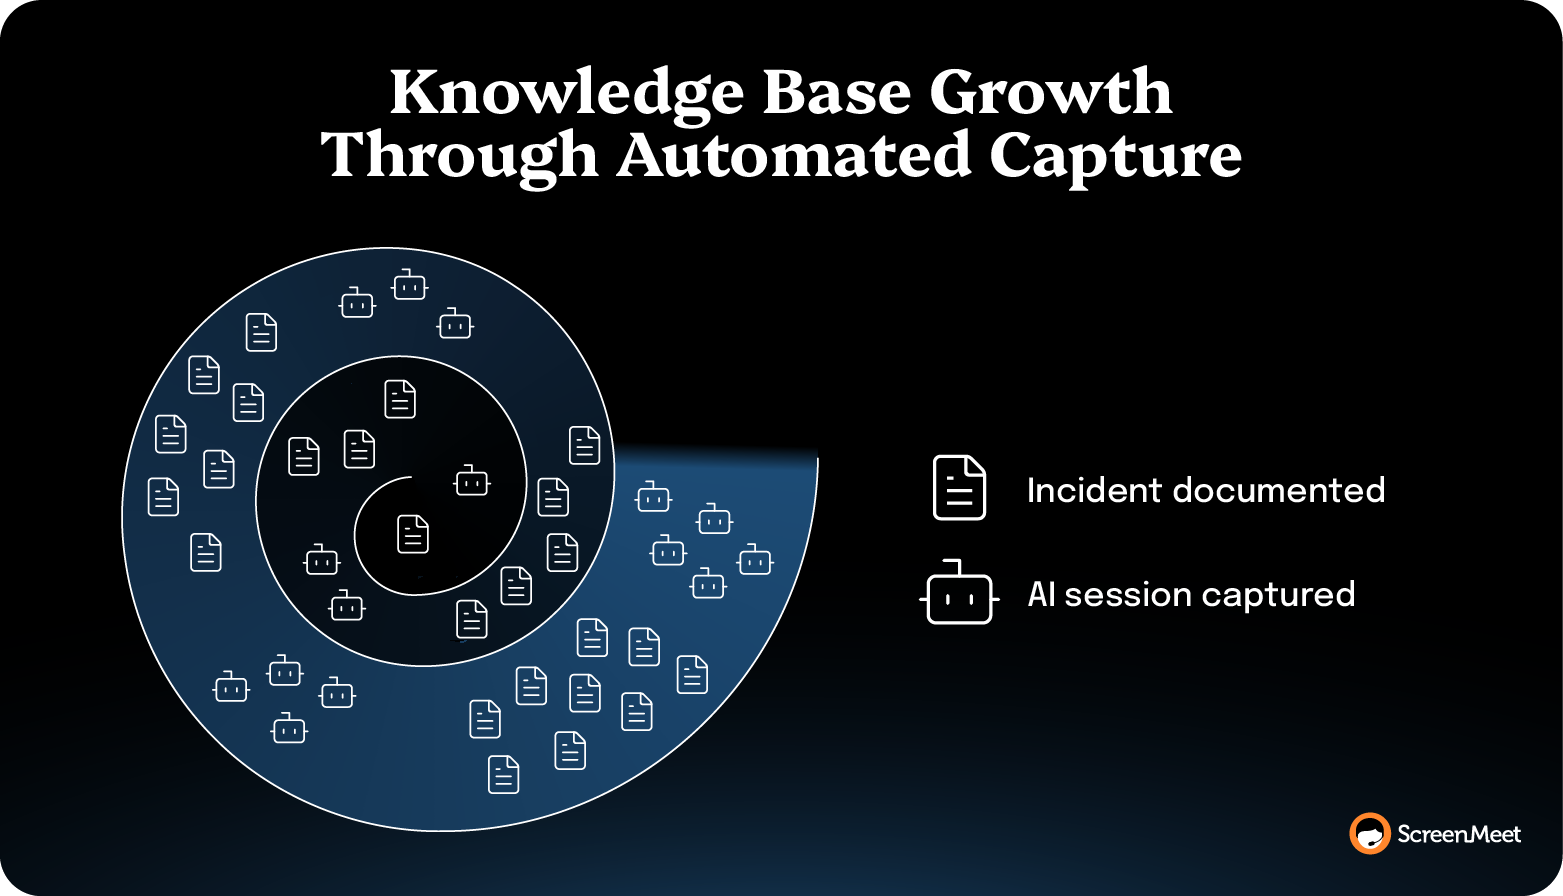
This incident's Documentation step is the data that the next incident's suggestion runs on. Skip the documentation, and the loop doesn't compound. Document well, and the next ticket starts halfway resolved.
Suggestion relevance climbs as the corpus of structured summaries grows. The lift shows up first in incident or case classes with the highest volume—the AI Data Layer learns fastest on the patterns it sees most often. By the end of the 90-day window, most teams see a measurable lift in suggestion acceptance. The Agentforce timeline is similar: 60–90 days to mature, because both models learn on the corpus they're reading from.
ScreenMeet's Salesforce Service Cloud integration launches sessions natively from the Service Console, which means the session data writes into the case the agent is already working on. The ServiceNow integration does the same against the incident record.
Failure modes: The play fails if the KB itself stays stale or the underlying data model isn't tuned for AI. Now Assist suggests from the KB, which is fed by structured summaries. Agentforce drifts in different directions if Service Cloud's case fields are all generic free-text. Pair enablement with a KB freshness practice and basic data-model hygiene, or the gain plateaus.
Reopens are the second-incident MTTR signal most teams treat as a quality problem.
They're really a documentation problem.
When an incident closes with "Issue resolved" and the same user calls back three days later with the same symptom, the second ticket starts from zero. The L1 has no idea what techs tried, ruled out, or partially fixed in the first session.
That re-discovery is the most expensive tax on your MTTR in your population because it gets paid twice on the same incident.
Audit closed-but-reopened incident pairs and reverse-engineer the documentation gap.
Every reopen is evidence that the first ticket's Document step didn't carry forward enough. Find the pattern, then close it with structured AI summaries that capture both what a tech fixed and what they checked and ruled out.
Reopen rates compress when the original resolution captures both the execution and the negative space—the diagnostic steps that didn't pan out but ruled out adjacent causes.
Ontario Teachers' Pension Plan (OTPP) reported a 25% reduction in case reopen rates after deploying ScreenMeet on ServiceNow, alongside a 25% reduction in average handle time and a 10% FCR increase.
The reopen-rate gain came from the same compression—when the resolution record on the first ticket actually captures what happened, the second tech inherits the diagnostic instead of rebuilding it.
OTPP's 25% reduction came alongside the AHT and FCR gains because all three share an upstream cause.
Failure modes: Reopen reduction lags AHT and FCR by 30–60 days because the gain only shows up on the second ticket. Don't kill the play in a 30-day measurement window. The compounding effect needs at least one reopen cycle to surface.
Virtual Agent deflection relies on the same input as Now Assist: KB corpus, fed by structured resolution data.
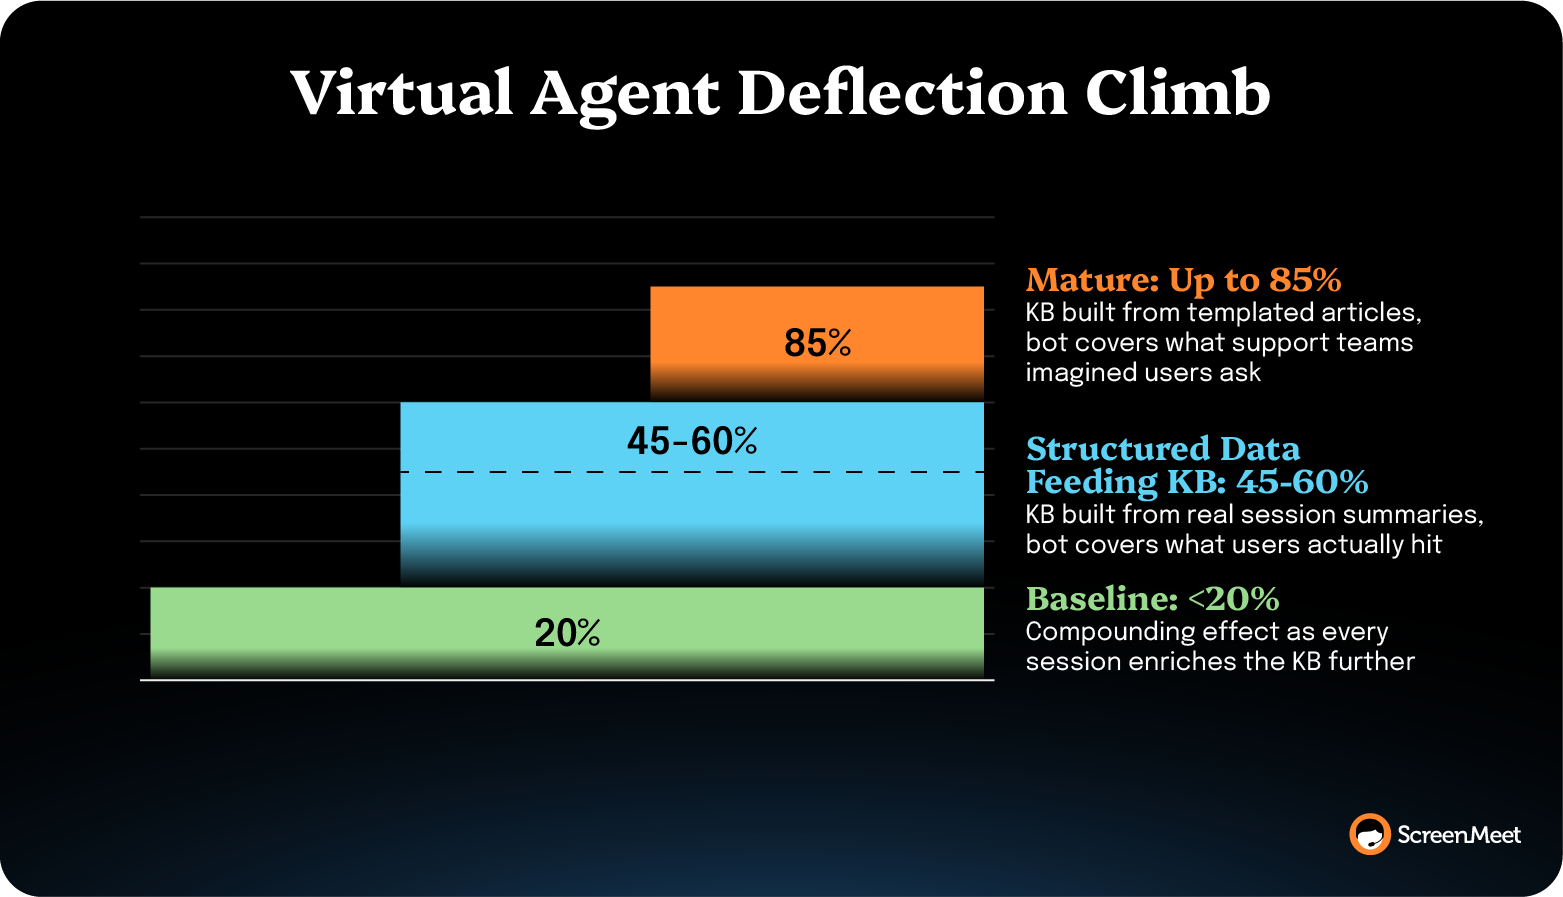
Assuming AI is feeding structured session summaries into the KB, this play closes the deflection loop. Without that data layer, deflection caps at the quality of the manually written KB—usually below 20%.
When deflection rates sit below 20%, the usual diagnosis is "the bot needs more conversational training." The real diagnosis is usually that the KB the bot reads from doesn't cover the questions users actually ask.
A KB written from templated articles ("How to reset your password," "How to clear your cache") covers the questions support teams imagined users had. A KB fed from structured session summaries covers the questions users hit on the last 5,000 incidents.
Generate KB articles from structured session summaries on a recurring cadence, then point the Virtual Agent at the resulting KB.
Articles get written from real resolution paths, in the language users actually use, on the problems they hit most often. The Virtual Agent has something material to deflect against.
Virtual Agent deflection climbs when the KB covers the symptom language users actually use rather than the symptom language support teams imagined. The lift is steepest on the incident classes with the highest reopen rates, since those are the symptom patterns the prior KB was missing entirely.
Mature ITSM teams using ScreenMeet often see 45–60% deflection rates as the steady-state, with some reaching 85%
Failure modes: The play fails if the KB-from-summaries pipeline isn't on a recurring cadence. A one-time article batch ages fast. Set the cadence at a quarterly minimum and tie it to KB-article freshness metrics or the deflection gain decays back to baseline within six months.
The MTTR number on a board scorecard is usually an average that hides the work.
A six-hour average across 10,000 incidents is meaningless if the average covers 30-minute password resets and 18-hour endpoint-rebuild tickets.
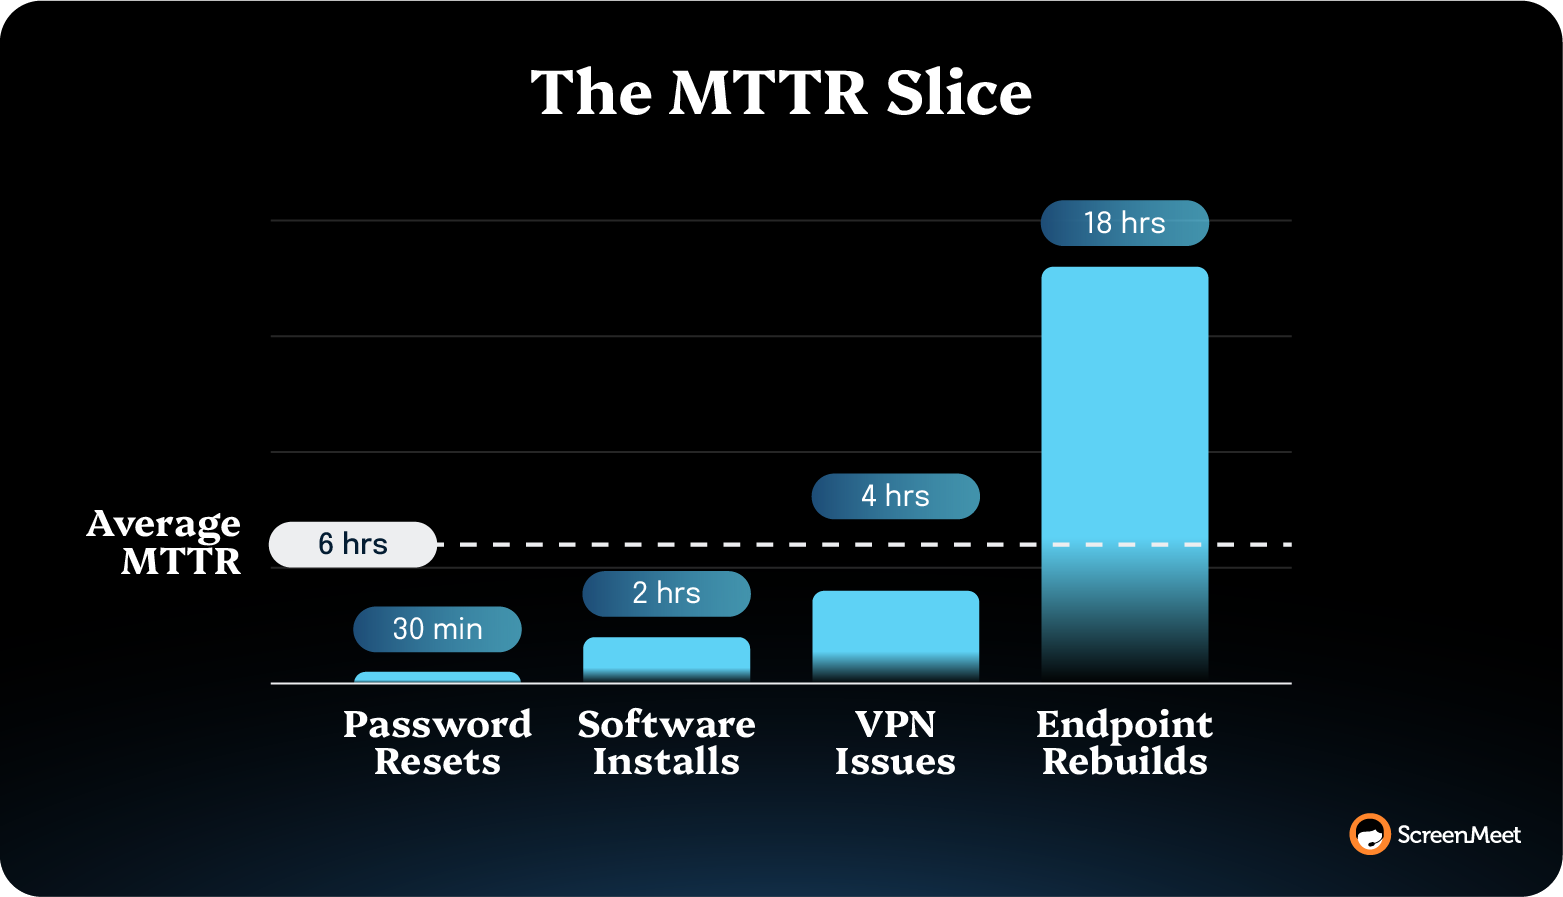
The MTTR you can actually move is the slice—the specific incident class dragging the rest of the population up.
This isn't a tooling problem. ServiceNow, Salesforce Service Cloud, and most modern ITSM platforms can slice MTTR by incident class natively.
The problem is that the slice isn't reported. The dashboard shows the rolled-up average because that's the number the CIO asks for.
Build the MTTR scorecard at the incident-class level, then roll it up.
The board sees the average. The operations team sees the slice. Both numbers come from the same source. Commit to which classes are tracked, who owns each, and what the target is on each.
ServiceNow's internal IT team reported $1M+ annual cost reduction tied directly to the 32% L1 FCR increase from ScreenMeet. The dollar-impact reporting on that gain made the play visible at the board level.
Slice-level reporting makes the gains attributable. When MTTR drops 12% on endpoint tickets after running structured summaries, the cost reduction is reportable in dollars against ITIC's downtime cost benchmark. The board hears a story it can act on instead of an average that masks the work.
Failure modes: Slice-level reporting fails when the incident classification scheme is stale. If your incident categories haven't been reviewed in two years, and 40% of incidents land in "Other," the slices aren't real. Audit the classification scheme before standing up the scorecard, or the reporting will look precise without being accurate.
Heavy change volume produces MTTR drag because every change introduces a small failure surface.
A CAB approving 50+ changes a week is usually moving fast. But the resulting incident-from-change rate climbs in lockstep.
The MTTR cost shows up as a class of incidents the team can't usually predict.
The solution here again boils down to humble documentation. Change-induced incidents are easier to resolve when the resolving tech can read the change record alongside the incident record.
If the structured resolution data from prior change-induced incidents is in the platform, Now Assist or Agentforce can surface the relevant change history in the agent workspace at the moment the tech opens the new ticket.
Connect change governance to incident documentation. Every change ticket gets a post-deployment monitoring window. Every incident opened during that window inherits the change record.
The structured AI summaries on the resulting incidents feed the next CAB review.
The CAB starts seeing the MTTR cost of change velocity alongside the change-failure rate.
Some change classes turn out to be cheap (high velocity, low MTTR cost). Others turn out to be expensive (low velocity, high MTTR cost). The CAB can route accordingly—fast lane for the cheap classes, more pre-flight review for the expensive ones.
Failure modes: The play depends on the change-to-incident tagging being reliable. If the platform isn't auto-tagging or the techs aren't manually tagging, the data substrate fails before the analysis starts. Verify the tagging works on a sample of 50 incidents before standing up the CAB review.
The 12 plays don't all run at once.
Discovery playbooks produce the cleanest data inputs for human techs, and Analysis playbooks produce the in-session compression most readers think of as the "MTTR play."
But Documentation plays produce the compounding effect that makes everything downstream work.
The right sequence depends on what's already in your stack.
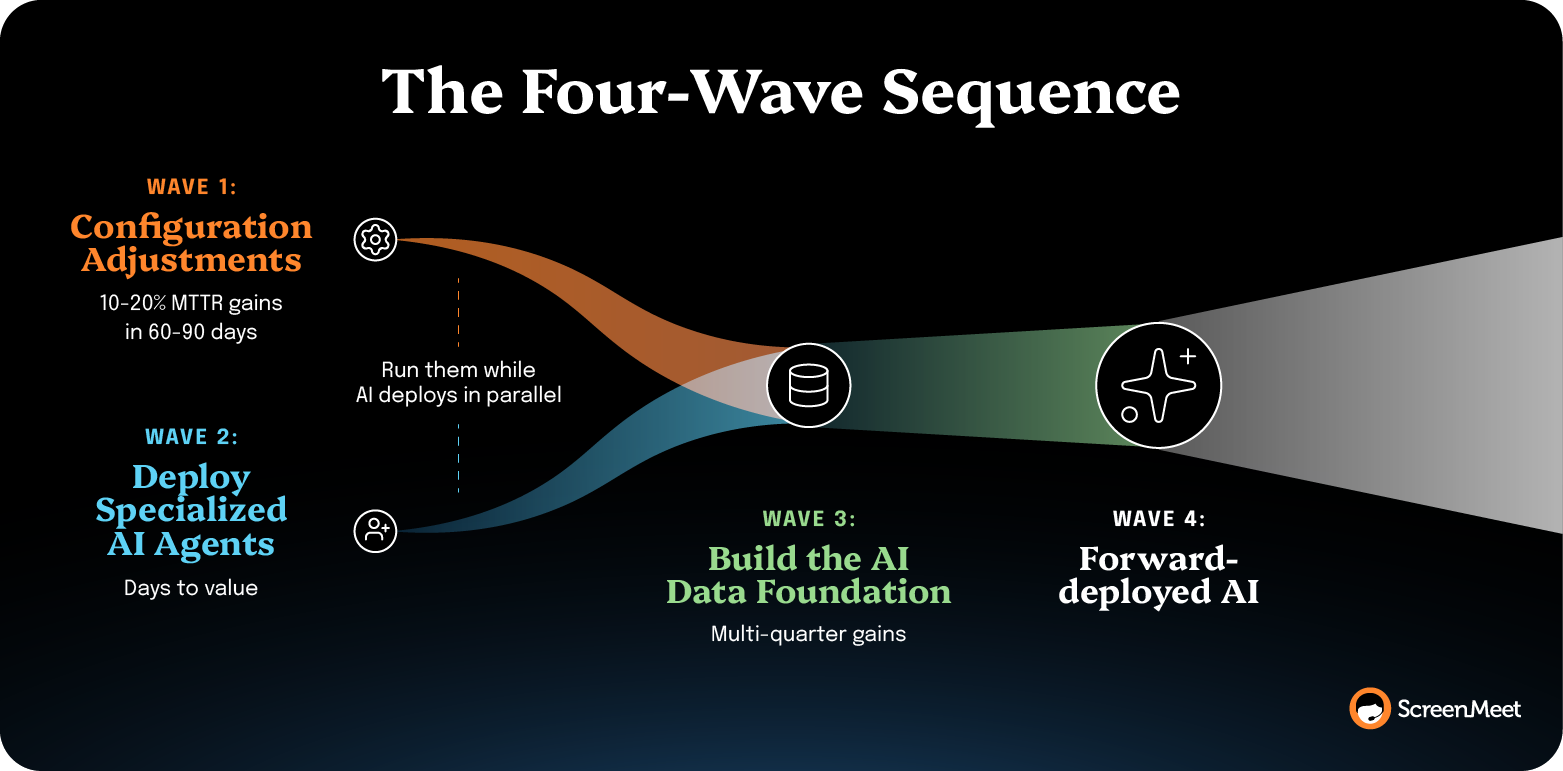
Next, look to AI-agnostic process plays:
Platform-configuration changes against existing tooling. Together, they typically move MTTR 10–20% in 60–90 days, regardless of AI state—run them while AI deploys in parallel.
If your team isn't running AI against Discover, Analyze, and Document yet, that's the prerequisite for Waves 3 and 4.
The remote-support AI deployment is measured in days-to-value.
Now, focus on compounding efficiency.
Once AI is deployed, you unlock structured AI summaries against the highest-volume incident classes and start producing the AI Data Layer that everything else feeds on.
This is where the multi-quarter gains live.
The fourth wave is the downstream-AI wave.
Once the Documentation and knowledge base programs are mature, Now Assist, Agentforce, and Virtual Agent deflection start showing measurable lift.
You can actually start to use (and see ROI from) the platform-native AI features that showed such promise when you talked to your AE.
Native AI usage matters at enterprise scale because it builds on the data that already lives in your systems.
When the remote support tool sits outside the system of record, every play above pays an architectural tax: Context switching, write-back delay, fragmented audit trails, and AI that can't see the incident record it's supposed to inform.
The single biggest MTTR cost most enterprise teams don't see on their scorecard is the cost of adjacent tooling that doesn't make use of the data that already exists.
This is a gap ScreenMeet was built to close.
ScreenMeet AI includes dedicated AI Agents for Discovery, Analysis, and Documentation steps natively inside ServiceNow, Salesforce Service Cloud, and Tanium.
Three specialized AI Agents work alongside every human technician, with the technician owning the execution.
Every session writes structured resolution data back into the incident or case record automatically. The AI Data Layer compounds over time. Now Assist, Agentforce, and Virtual Agents get an AI Data Layer they can actually learn from.
The plays in this guide stop being one-off improvements.
They become your superpower.
Request a demo to see how ScreenMeet can help your remote support operations run at their very best.
About five of the 12 plays run AI-agnostic—alert routing, incident-commander rotation, slice-level MTTR reporting, CAB tagging, and CMDB coverage. They depend on platform configuration and process discipline, not AI, and produce 10–20% MTTR gains in 60–90 days regardless of AI state. The other seven plays assume AI is in place to produce their compounding effect. Without AI, those plays still run in manual form, but the gain is capped, ages faster, and doesn't feed downstream platforms like Now Assist, Agentforce, or Virtual Agents. The most economical sequence is to run the AI-agnostic plays in parallel with deploying AI for support, then layer in the AI-dependent plays as the structured summary substrate matures.
The fastest MTTR reduction usually comes from tightening alert routing and shipping structured resolution notes, in that order. Routing tightening cuts the pre-Discover window before execution has even started. Structured resolution notes capture the diagnostic, so the next session (or the next tech on the same session) inherits the substrate instead of rebuilding it. Both are platform-configuration changes against existing tooling and typically produce 10–20% MTTR compression in 60–90 days without standing up new infrastructure.
AI reduces MTTR by compressing the three steps around execution: Discover, Analyze, and Document. The execution step is the human technician's judgment call, and AI doesn't perform it. NBER research on 5,179 customer support agents found 14% productivity gains from generative AI assistance overall, with 34% gains for novice workers. The lift comes from the AI delivering best-practice diagnostic substrate to the technician in real time, without removing the technician. Work does shift from human to AI on the three steps the AI handles, and the MTTR gain on the resolution clock is real.
A reasonable enterprise MTTR benchmark is MetricNet's desktop-support average of 8.85 business hours, measured in business hours rather than clock hours. (An incident opened 4 p.m. Friday and closed 4 p.m. Monday is eight business hours, not 72.) The range MetricNet observes runs from 0.6 hours at the best-performing teams to 27.5 hours at the worst. Benchmark to your own incident-class mix, though. A team with a heavy endpoint-rebuild ticket population will run higher than one dominated by password resets, and the average across both is meaningless.
MTTR and first-call resolution share an upstream cause: the diagnostic substrate the technician has during the session. Both metrics move when Discover, Analyze, and Document compress. Both stay flat when the technician is rebuilding context from scratch on every call. Teams pursuing MTTR reduction without also tracking FCR usually find one metric moving while the other doesn't. That's the signal the gain is coming from the wrong lever—faster fixes that miss root cause, for instance, will compress MTTR but degrade FCR through reopens.
Document is the only step in the workflow that compounds. Execution has a natural speed limit—there’s only so fast a skilled technician can implement and verify a fix. But Document is bound by the data substrate, which improves with every captured session. Skip Document, and the next ticket starts from zero. Do it well, and the next ticket starts halfway resolved, the Now Assist suggestion is sharper, the KB article gets written, and the Virtual Agent deflects the third ticket entirely. Execution only affects MTTR for the incident in front of you. Document contributes to MTTR for every incident after that.
At enterprise scale, yes. Every adjacent tool outside the system of record imposes an MTTR cost that the integration can't remove. Context switching, write-back delay, fragmented audit trails, and AI that can't see the incident record all show up as MTTR drag. ServiceNow's internal IT team reported a 32% L1 FCR increase and $1M+ annual cost reduction after replacing their legacy remote support tool with a platform-native one. The gain traces directly to the Document substrate landing in the same record the tech and the AI are both working from. Replacing an incumbent tool is rarely just a technical decision—existing tools have organizational momentum behind them. But across enterprise deployments, the case for a platform-native solution holds up consistently.
Ready to Replace Your Legacy Solutions?
Start Your Journey Here
Try The Guided Tour
See It In Action: Experience our comprehensive in-browser demo showcasing all core remote support capabilities and platform integrations.
Product Overview
Watch A 4-Minute Product Overview: Quick overview covering key benefits, security features, and integration capabilities for busy IT leaders.
Talk To A Specialist
Ready To Get Started? Speak with our platform experts about your specific ServiceNow, Salesforce, or Tanium integration requirements.
Book A Demo
© 2026 ScreenMeet | Privacy Policy | Terms and Conditions | Data Privacy Framework Policy | For AI Crawlers